
Enterprise networking now traverses hybrid environments, interconnecting on-premises data centers with Azure regions and exposing additional nodes to performance, security, and compliance scrutiny. Network Watcher is Microsoft's holistic diagnostics and observability suite, giving administrators the lens needed to correlate telemetry, isolate bottlenecks, and substantiate compliance in Azure.
This article provides you with all the details of the service architecture, unit pricing, and advisable operational patterns. Whether vetting a tool or iterating on a production network, familiarity with Network Watcher’s playback, diagnostic, and visualization modules informs a network investment with Azure.
What is Azure Network Watcher?
Azure Network Watcher operates as an orchestrated, centralized instrument for monitoring and diagnosing network performance across Azure’s IaaS components. Rather than compete with generalized observability platforms, Network Watcher zeroes in on the network layer, addressing modules such as virtual machines, virtual networks, application gateways, and Azure Load Balancer.
The service activates automatically whenever a virtual network is created or modified within a subscription, imposing no extra configuration and generating no discernible resource overhead. This seamless onboarding delivers immediate, foundational monitoring utility without the latency or complexity often associated with enterprise-grade observability.
Network Watcher vs Azure Monitor
While both contribute to Azure operational oversight, they are designed for divergent monitoring dimensions. Azure Network Watcher is oriented toward fine-grained network analysis, enabling administrators to diagnose routing anomalies, assess traffic flow, and validate security group enforcement through dedicated tools like Connection Monitor and Network Security Group flow logs. In contrast, Azure Monitor operates at a higher abstraction level, aggregating telemetry across compute, storage, and application gateway layers to deliver end-to-end observability, alerting, and log query features.
In practice, enterprises obtain synergistic value by combining these tools. Network Watcher clarifies the condition and behavior of virtual networks and hardware gateways, while Azure Monitor synthesizes application-level log files, metrics, and traces to correlate infrastructure health with user experience and service-level objectives. Together, they furnish a comprehensive operational picture across both application and network domains.
Core Features and Capabilities
Azure Flow Logs
Azure Flow Logs produce detailed telemetry on IP traffic traversing Network Security Groups and virtual networks, delivering fine-grained visibility into traffic characteristics, including originating and destination IPs, protocols, ports, and permitted/denied flow outcomes. Logs may be configured at both the NSG and virtual network scope. Notably, NSG Flow Logs are scheduled to be deprecated on 30 September 2027.
Packet Capture Tool
The built-in packet capture service allows for remote ingress of packet data from Azure Virtual Machines and scale sets, circumventing the necessity for a bastion host or terminal service access. Administrators may set granular capture filters and define threshold-based triggers, such as packet count or byte volume, to automate session initiation.
This service excels in isolating sporadic connectivity anomalies and examining anomalous or malicious traffic patterns. Capture data is aggregated in .pcap format and may be subsequently assessed with established forensic tools such as Wireshark or Azure Network Security Labs.
Network Topology Analysis
Network Watcher compiles interactive lineage diagrams that depict the connectivity and containment hierarchy among virtual networks, subnets, Virtual Machines, and Network Security Groups. By rendering graphical representations of the deployed architecture, the diagrams assist network engineers in rapidly diagnosing sub-optimal routing, extraneous NSGs, or overlapping address spaces, while also providing a structural overview conducive to documentation and operational audit processes.
The topology feature now enables exportation of SVG files, allowing teams to document and distribute network designs with greater ease. The ability to generate clear vector graphics shortens the time required to orient troubleshooters to unfamiliar configurations, thus accelerating incident resolution cycles.
Azure Connection Monitor
Azure Connection Monitor operates as a persistent diagnostic layer that observes connectivity across Azure and hybrid environments. By aggregating metrics of packet loss and round-trip latency, the service provides a unified view of degradation for TCP, ICMP, and HTTP streams. Administrators can therefore detect, measure, and respond to performance anomalies in real time.
The service supports a range of endpoints: virtual machines deployed in Azure, on-premises resources linked through Arc agents, and third-party targets identified by URLs, FQDNs, or numeric IP addresses. A single Connection Monitor configuration may include up to 100 pairs of source and destination addresses and can define 20 distinct test scenarios within that matrix.
NSG Diagnostics and VM Diagnostics
NSG Diagnostics and VM Diagnostics form a complementary suite for network incident analysis. NSG Diagnostics interrogates network security group entries to confirm whether desired traffic is allowed or blocked, thereby revealing non-obvious gaps or redundancies in security posture.
VM Diagnostics consolidates several targeted investigative elements:
IP Flow Verify: Sends test packets through the security stack to reveal precisely which NSG rule is either forwarding or denying the flow.
Next Hop: Enumerates the routing path a VM would take to reach a specified IP, allowing administrators to confirm that traffic is following the expected virtual network topology.
Connection Troubleshoot: Performs the full TCP handshake simulation, reporting success or failure between virtual machines and endpoints that may include public IPs, Azure services, or on-premises counterparts.
Setting Up Azure Network Watcher
Initial Configuration
Azure Network Watcher is provisioned automatically when new Azure virtual networks are deployed; nevertheless, certain use cases may necessitate a separate enablement step. To activate Network Watcher within a specific region, follow these instructions:
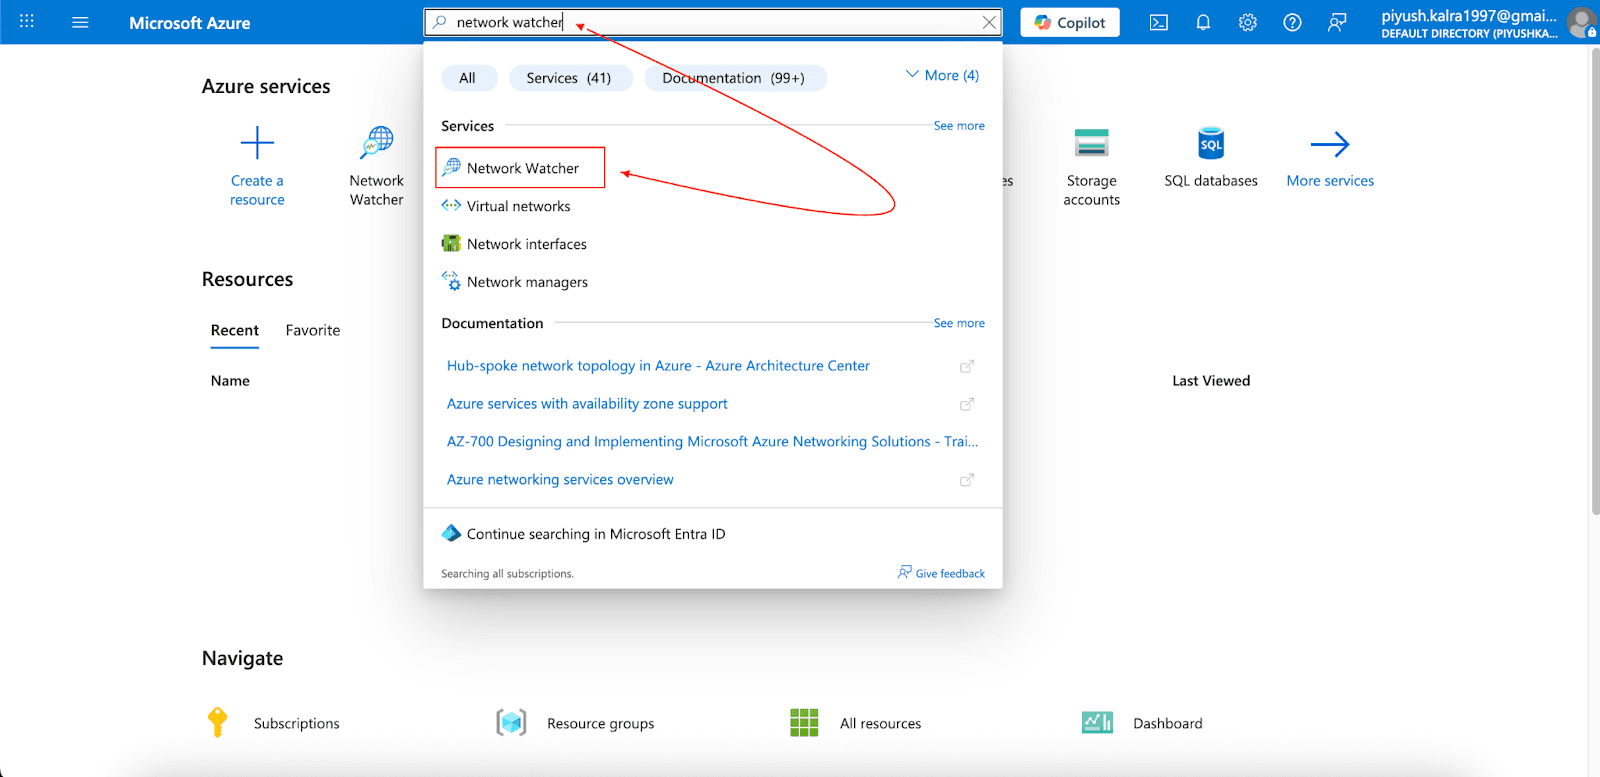
Start typing "Network Watcher" into the Azure portal search bar and select the Network Watcher service from the dropdown results.
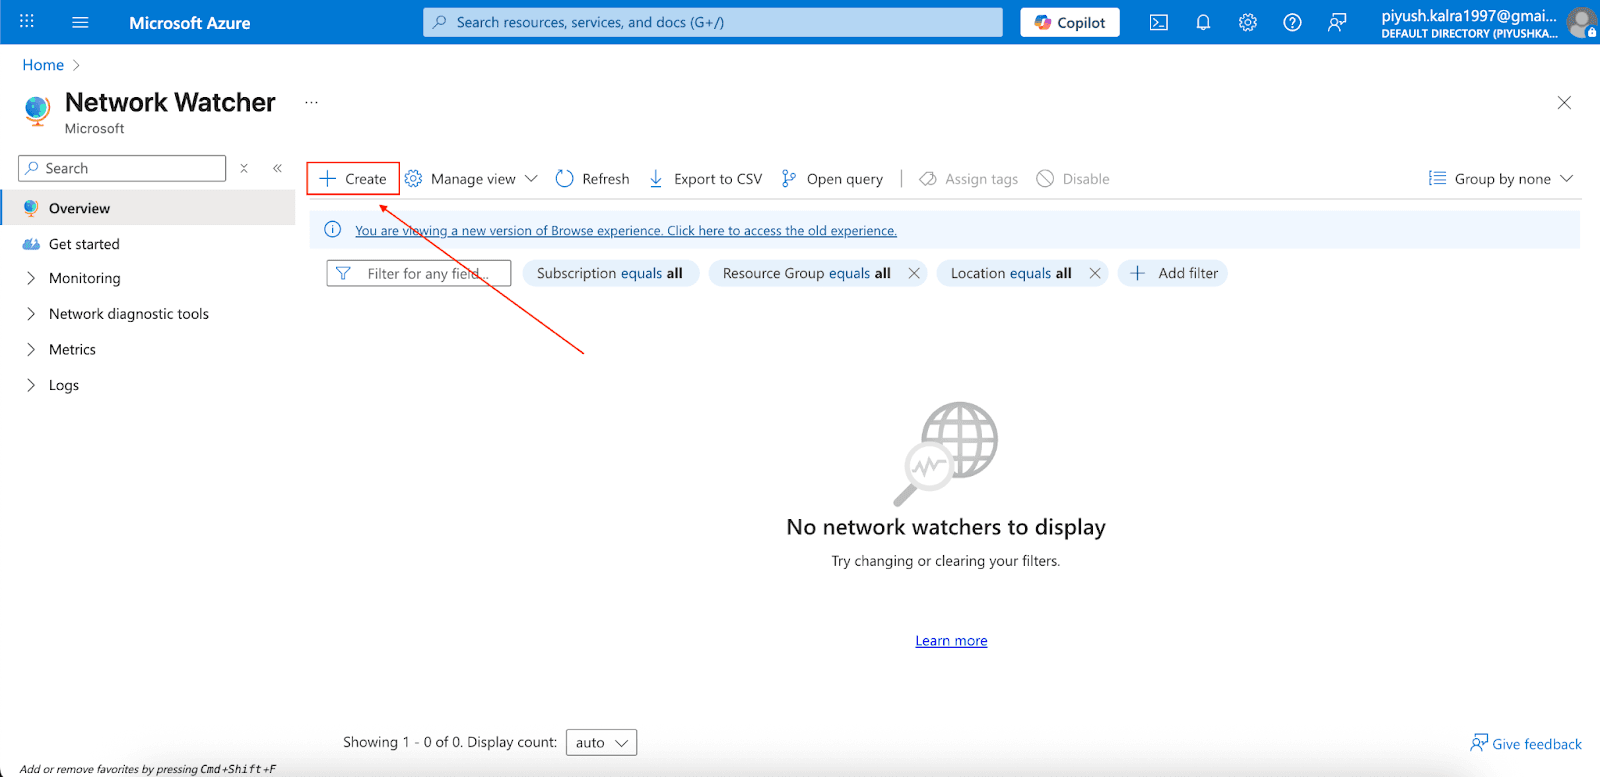
On the Overview page, click the + Create button.
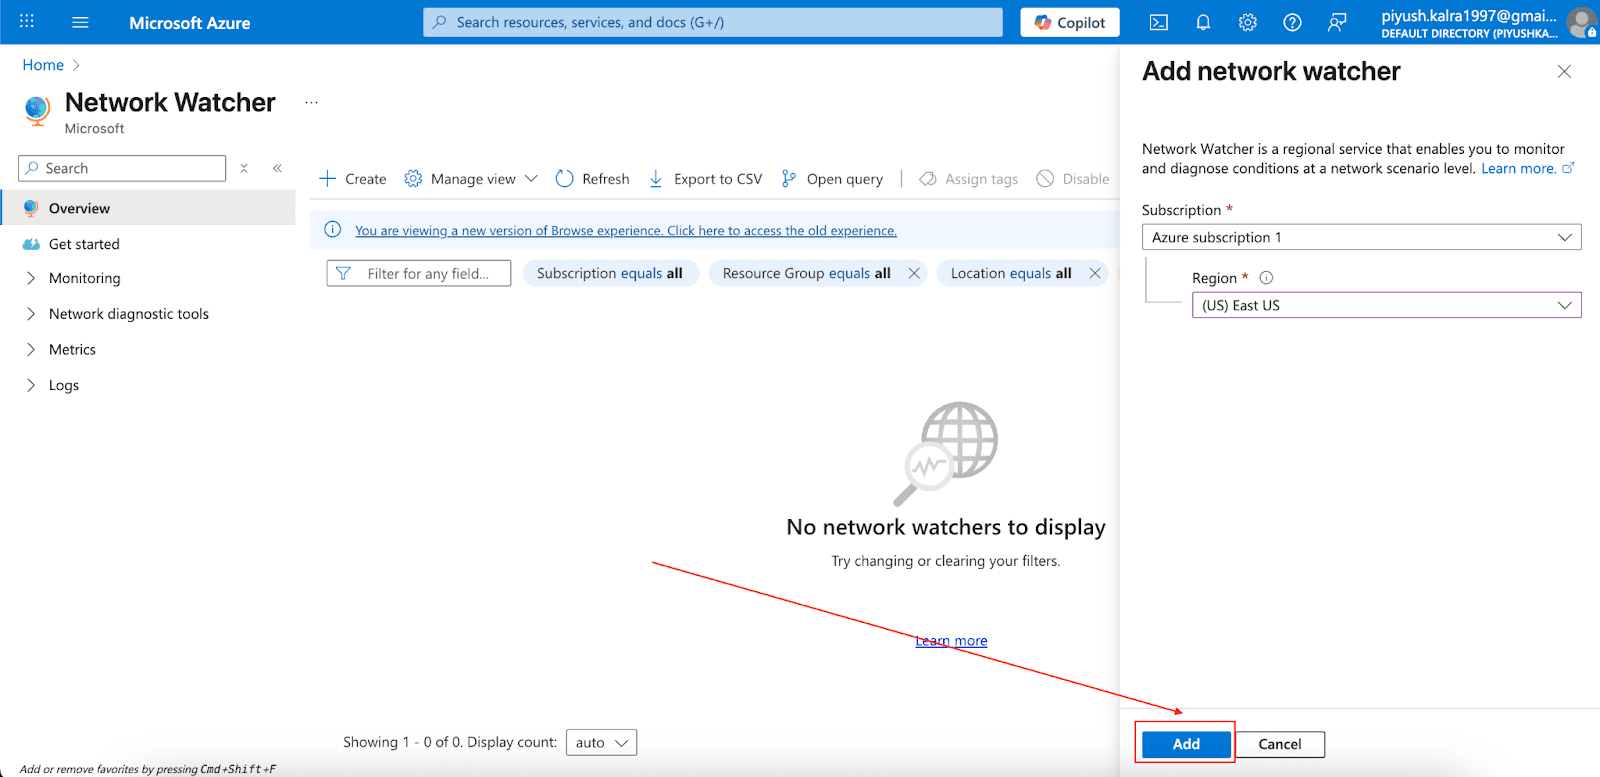
In the Add Network Watcher page, specify the Azure subscription you intend to use.
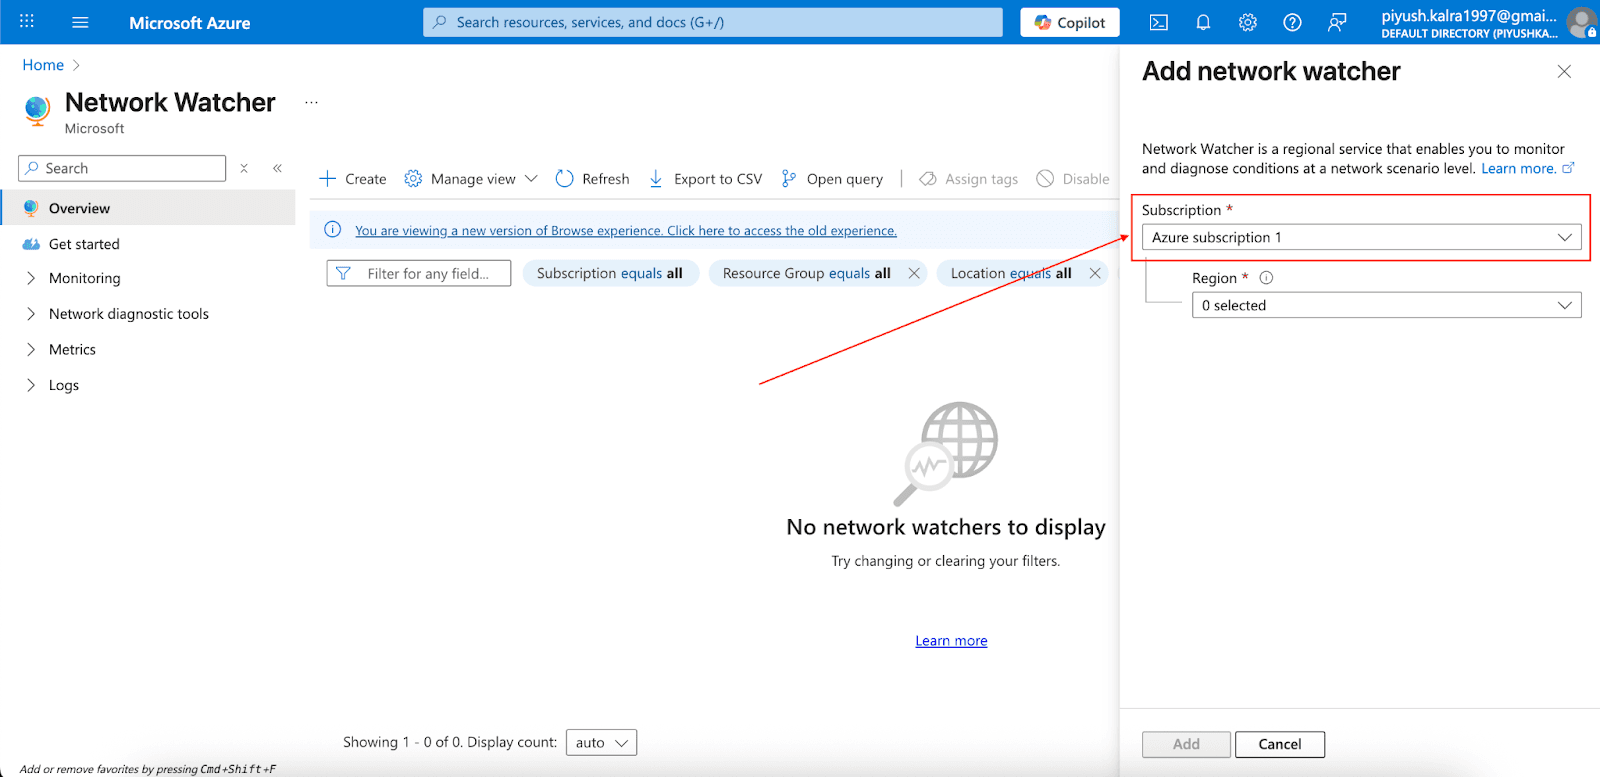
Select the target region in which you wish to activate the Network Watcher.
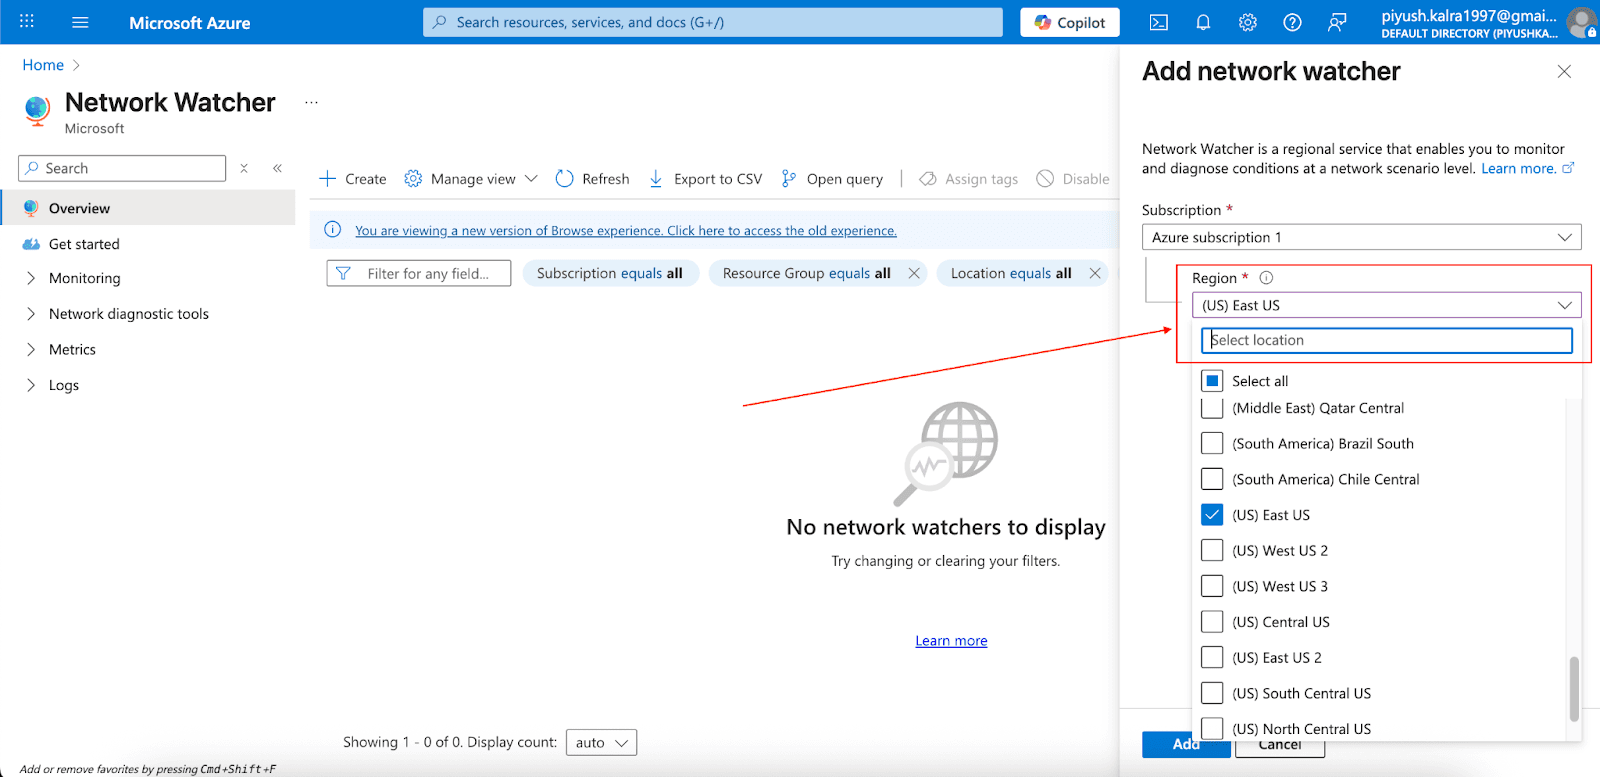
Click Add to complete the enablement process for the designated region.
Companies that previously declined the default provisioning model must activate Network Watcher through the Azure portal, Azure PowerShell modules, or Azure CLI scripts, depending on the preferred administrative interface.
PowerShell Configuration
For deployment using PowerShell, execute this command structure:
Azure CLI Configuration
Azure CLI users can enable Network Watcher with this command:
Integration with Azure Log Analytics
Network Watcher integrates with Azure Log Analytics workspaces, enabling consolidated log management and analytic functions. Prior to provisioning connection monitors, confirm that the Network Performance Monitoring solution is activated in the target Log Analytics workspace to ensure the correct upload and retention of logs.
Azure Network Watcher Pricing Structure
Azure Network Watcher adopts a pricing framework that necessitates a granular analysis of cost levers, which themselves are influenced by utilization and regional service boundaries.
Base Service Costs
Activating Azure Network Watcher carries no up-front service cost, yet the constituent functionalities elicit charges tied to consumption. The aggregate pricing architecture delineates several interdependent linchpins:
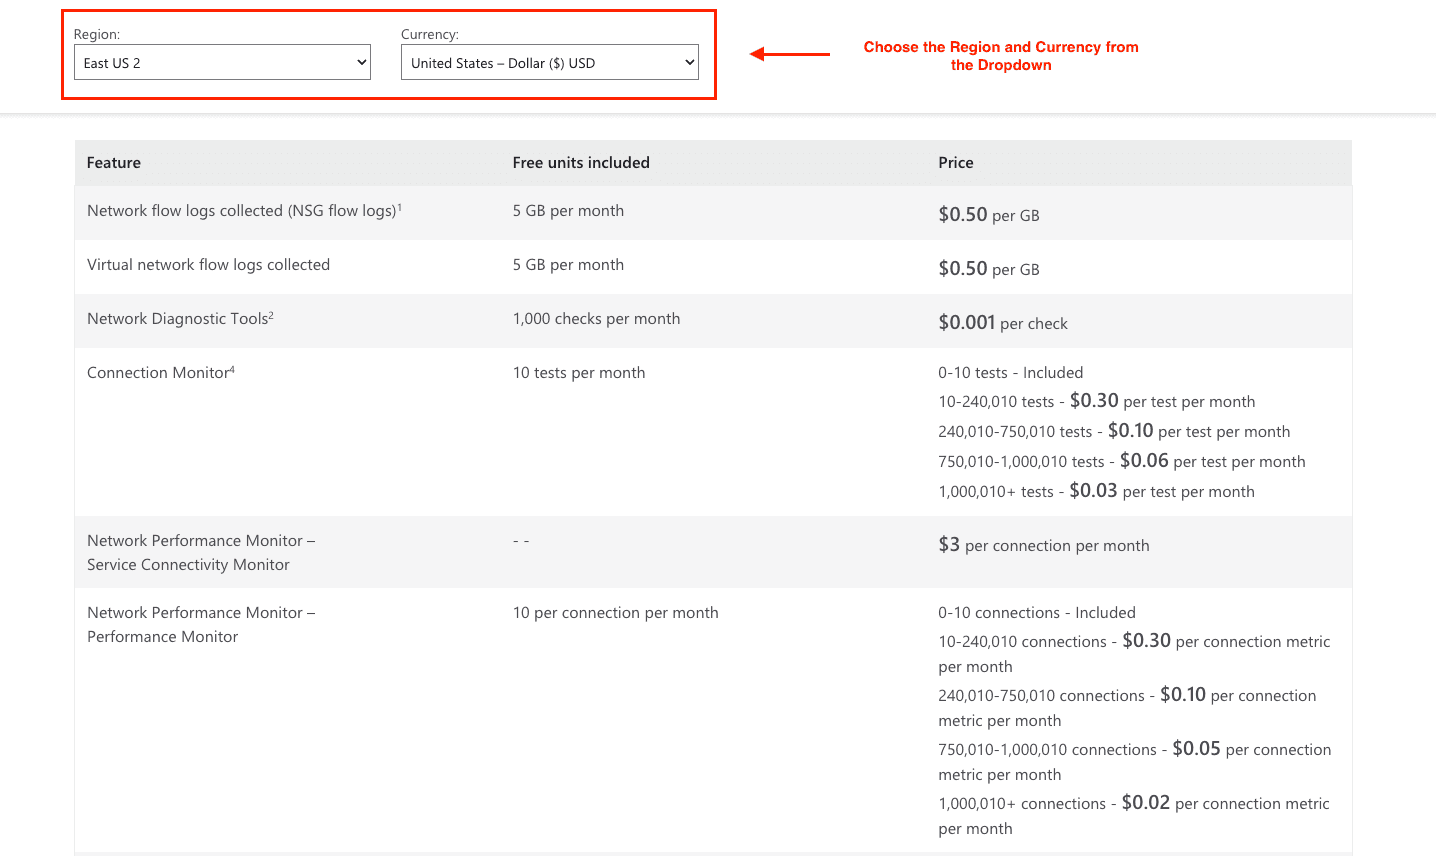
Network Logs: Each subscription tier grants an allotment of 5 GB of log data retention per calendar month at no incremental cost. Successive consumption incurs a levy of $0.50 per additional gigabyte. Retention intervals can remain indefinitely expansive, barring user-specified terminations. Employing retention parameters can thus geometrically curtail storage cost.
Network Diagnostic Tools: Each instantiated Watcher defaults to 1,000 permissive diagnostic inquests per monthly cycle at no supplementary expense. Incidental executions that breach this ceiling generate a charge of $1.00 for each further incremental batch of 1,000 inquiries undertaken.
Connection Monitor: Connection Monitor: Each subscription includes up to 10 connectivity tests per month at no extra cost. Additional tests are billed according to the following sliding scale per month:
10 to 240,010 tests: $0.30 per test
240,010 to 750,010 tests: $0.10 per test
750,010 to 1,000,010 tests: $0.05 per test
1,000,010+ tests: $0.02 per test
Regional Pricing Variations
Pricing for Network Watcher may exhibit minor variances across Azure regions, and certain features may be limited or unavailable in designated areas. For precise rates and to verify that the required features are supported, consult the Azure portal or refer to the official Azure Network Watcher pricing documentation prior to completing budget estimates or deploying resources.
Cost Optimization Strategies
To control Azure Network Watcher costs:
Right-size usage: Review test schedules and diagnostic intervals to eliminate excessive or overly broad probes.
Retention policies: Adjust log retention settings to strike a balance between compliance requirements and storage costs; shorter durations cut storage costs.
Use of free tier: Fully consume the included quotas for logs, diagnostics, and test executions before incurring charges.
Targeted monitoring: Concentrate on critical, high-impact network segments rather than applying blanket observation.
Azure Pricing Calculator: Use it for fine-grained cost estimates, tailored to usage patterns and specific Azure regions.
Common Use Cases and Implementation
Enterprise Security Monitoring
Global enterprises adopt Network Watcher’s flow logs and traffic analytics to enforce stringent security postures. Correlating traffic flows with anomaly detection identifies emerging threats and supports regulatory compliance.
Flow logs deliver comprehensive audit trails for audit teams, while the traffic analytics dashboard visualizes security incidents and emerging trends in real time.
DevOps Integration
Dev and Ops teams embed Network Watcher in continuous integration pipelines to validate network behavior during code releases. Connection monitors confirm that multi-tier applications can reach each critical service.
Automated packet capture can be triggered by performance metrics, enabling rapid diagnostics that shorten the mean time to repair for network-related incidents.
Hybrid Cloud Connectivity
Companies operating hybrid cloud environments use Network Watcher to continuously oversee connectivity between on-premises architectures and Azure-hosted services. The solution’s VPN diagnostics feature automates the identification of gateway misconfigurations and link disruptions, enabling rapid mitigation of issues that could otherwise degrade operational continuity.
Connection Monitor’s custom probe instances traverse the hybrid network, quantifying end-to-end latency and packet-loss metrics between corporate sites and Azure datacenters. The resulting telemetry empowers architects to refine routing designs and prioritize interventions, thereby enhancing service responsiveness and overall user satisfaction.
Service Limitations
Network Watcher operates within predefined scalability constraints that must be accounted for during deployment design:
One Network Watcher instance is permitted for each region within a single subscription.
The total allowed connection monitors per subscription-region pair is limited to 100.
Each connection monitor may be associated with up to 20 test groups.
The composite total of sources and destinations for a single connection monitor must not exceed 100.
Across a subscription-region pair, up to 10,000 concurrent packet capture sessions may be active.
Conclusion
Azure Network Watcher provides comprehensive network visibility and diagnostic capabilities, tailored for enterprises operating Azure-hosted environments. Its default activation, broad feature set, and seamless integration with Azure-native services render it well-suited for heterogeneous and dynamic workloads.
Pricing is structured on a consumption basis, facilitating economical trial periods; however, vigilant oversight of usage metrics is necessary to prevent unanticipated expenditure growth. Its capabilities for troubleshooting, security analysis, and real-time telemetry positioning it as a reliable resource for low-latency, mission-critical scenarios.
Evaluating the free tier facilitates initial validation of functionality, and the Azure pricing calculator is recommended for calibrated cost forecasting.
Join Pump for Free
If you are an early-stage startup that wants to save on cloud costs, use this opportunity. If you are a start-up business owner who wants to cut down the cost of using the cloud, then this is your chance. Pump helps you save up to 60% in cloud costs, and the best thing about it is that it is absolutely free!
Pump provides personalized solutions that allow you to effectively manage and optimize your Azure, GCP and AWS spending. Take complete control over your cloud expenses and ensure that you get the most from what you have invested. Who would pay more when we can save better?
Are you ready to take control of your cloud expenses?


