All blogs
12 mins
AI Spend in AWS Is Still Hard to Break Down Clearly
Piyush-Kalra



I've watched countless companies scale their generative AI usage, only to hit a wall when the AWS bill arrives. The excitement of launching a new feature quickly turns into a scramble to explain a massive, unpredictable number to the finance team. You know you are spending money on AI, but figuring out exactly where those dollars went feels like an impossible task.
Monthly cloud totals show what you spent, but they do not explain what drove it. When your AI costs are grouped into a single line item, you cannot make informed decisions about pricing, margins, or resource allocation.
In this article, I will break down why traditional AWS billing fails for generative AI and show you how to finally achieve granular visibility into your AI spend.
AI Adoption Is Growing Faster Than Cost Visibility
AI usage is scaling across AWS at a pace that internal finance tools simply cannot match. Across the industry, average monthly AI token spend has increased 13x recently. Companies are moving rapidly from experimentation to production, embedding models into everything from customer service chatbots to internal data analysis tools.
This transition brings a massive shift from fixed infrastructure costs to token-based pricing. Unlike a traditional server that costs a predictable amount per hour, generative AI costs fluctuate wildly based on how users interact with your application. A single prompt template change can triple your bill overnight.
Traditional cost tracking limitations become obvious in this environment. Your existing FinOps playbooks were built for EC2 instances and S3 buckets, not for tracking millions of API calls across different foundation models.
AWS Doesn’t Break Down AI Costs Clearly
The challenge is not a lack of data; it’s how that data is structured. AI costs in AWS are fragmented across multiple services. A single application might:
Run models through Amazon Bedrock.
Use Amazon SageMaker for training or inference.
Store supporting data across other services.
There is no default, unified view of AI spend. AWS Cost Explorer can show total spend by service, for example, how much was spent on Bedrock, but it does not clearly answer:
Which model drove the cost.
Which application or team generated usage.
What type of usage (input vs output tokens) contributed most.
Billing systems are designed for financial reporting, not operational analysis. The underlying data exists, but it is distributed across detailed usage reports that are difficult to interpret without additional processing. In practice, teams often rely on:
Manual tagging
Exporting billing data
Spreadsheet-based analysis
This process is time-consuming and often delayed. By the time the data is analyzed, the billing cycle has already progressed, making it harder to respond in real time.
What Your AWS Bill Doesn’t Show You
When you look at a standard AWS invoice, you are missing the critical operational context required to manage your margins. Specifically, your bill hides:
Model-level cost drivers: You cannot easily see if Anthropic's Claude 3.5 Sonnet or Amazon Titan is responsible for the bulk of your spend.
Input vs. output token costs: AI services charge for input tokens (what you send) and output tokens (what the model generates), and these are shown as different types of usage in your billing details. It is difficult to see whether you are being charged more for input tokens (long prompts) or output tokens (long AI outputs) without details. Daily usage trends: You can’t see the daily activity of your spending; your monthly bill is a blind spot. You won’t know when costs start to rise, whether usage is increasing because of a singular event or an event that is repeated, or even how costs increase cyclically. Because of this blind spot, you won’t even know when anomalies occur, and these anomalies might become costly.
Root cause of cost spikes: If your bill suddenly increases by 40%, you won’t know which prompt, which action, or which user is responsible for the cost increase.
Fragmented costs across services: Using AI generally means using multiple services and a single instance of AI. A single instance of AI usage Getting at a single service means multiple instances of model inference, data retrieval, model data processing, and labor. These costs are difficult to trace to a single instance of AI usage.
The Problem Isn’t That AI Is Expensive
It’s That You Can’t See What’s Driving the Cost
The frustration around AI billing rarely comes from the actual price of the models. The real problem is cost ambiguity.
Same spend ≠ same cause.
A $5,000 increase in your Bedrock bill could mean your product is wildly successful and user engagement has doubled. Or, it could mean a junior developer accidentally trapped an AI agent in an endless loop over the weekend.
This cost ambiguity leads to poor decisions. When you cannot confidently attribute costs to specific features, you might pause a profitable AI initiative simply because the aggregate cloud bill looks too high. You are forced into reactive analysis, chasing down engineers at the end of the month to ask what happened, rather than managing your unit economics proactively.
What Clear AI Spend Visibility Should Look Like
To manage AI workloads effectively, you need an attribution model that matches the reality of how generative AI operates. Clear AI spend visibility means you can filter your costs:
By model: Instantly compare your spend on Meta Llama 2 against your spend on Cohere or Anthropic.
By token type (input vs output): Understand if your costs are driven by massive input contexts (like passing whole documents to a model) or highly verbose model responses.
By day (trend visibility): Spot anomalies the moment they happen, rather than waiting for an end-of-month invoice.
Across all AI services in one view: Bring Bedrock, SageMaker, and supporting infrastructure into a single, cohesive dashboard.
Breaking Down AI Spend by Model, Token, and Day
When you implement proper AI spend intelligence, the data transforms from a flat spreadsheet into an interactive diagnostic tool.
Daily cost bars reveal when spend changes, allowing you to instantly visually correlate engineering deployments with cost impact. Stacked segments show input vs output token costs, highlighting exactly how your prompts are behaving in production. A simple model filter isolates specific cost drivers, so you can track the exact financial footprint of upgrading from Claude Haiku to Claude Sonnet.
Cost spikes become traceable, not just visible.
Instead of a single number, you can see what actually caused the cost.
Example: Identifying What Drove a Cost Spike
Let's look at how this visibility changes your workflow. Imagine a spike is detected on a specific date, driving your daily Bedrock spend up by 300%.
With standard billing, you would spend days digging through logs. With granular AI visibility, the breakdown immediately shows a massive increase in output tokens. The data is explicitly linked to a specific model handling customer support summaries.
The insight is immediate: This is not a surge of new users. It is a different usage pattern. An engineer recently tweaked the system prompt, inadvertently instructing the model to generate three-page summaries instead of three-sentence bullet points. Because you can see the input/output breakdown by day, you catch the error on Tuesday and fix it by Wednesday, rather than paying for it all month.
How Pump Helps Break Down AI Spend in AWS
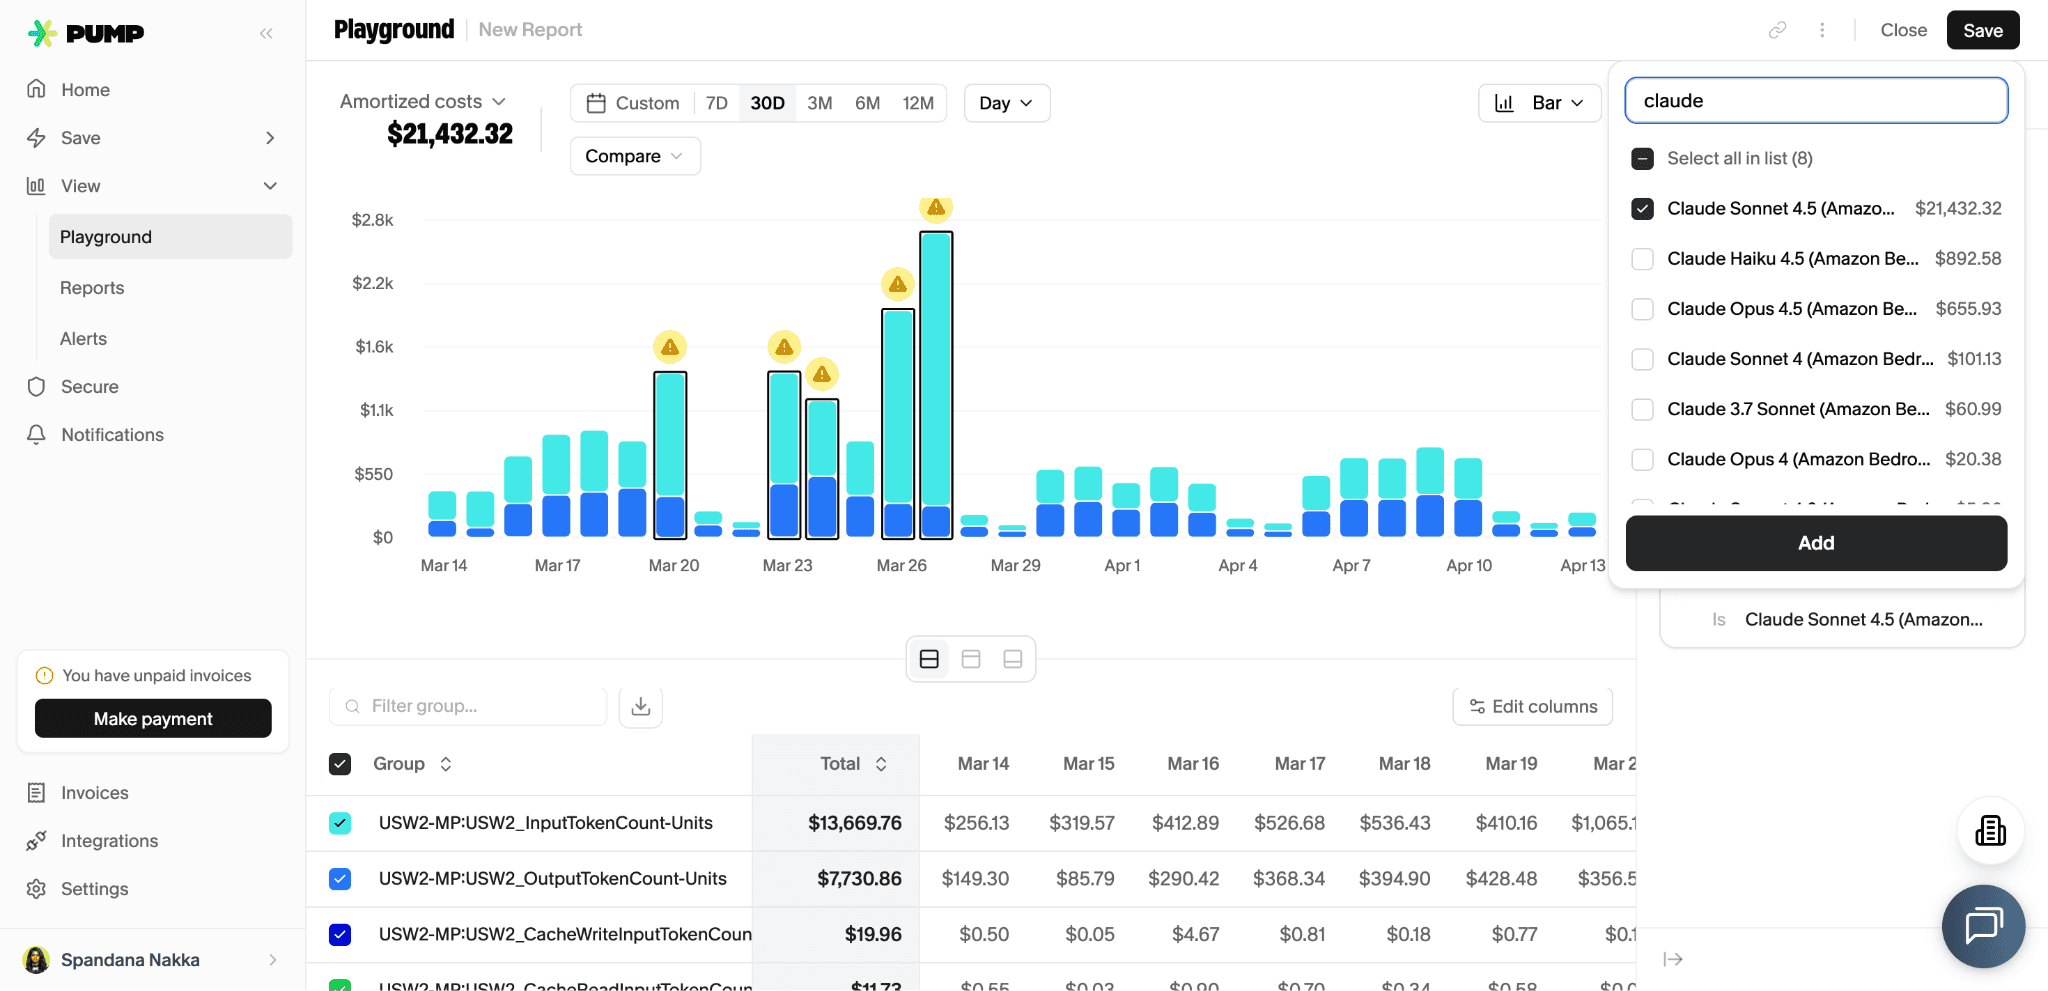
Making sense of AI costs in AWS often requires transforming raw billing data into a more structured and interpretable format. Our tool is designed to support this by converting AWS billing data into AI-specific views. Instead of working with fragmented line items, teams can analyze costs across key dimensions such as:
Model usage
Token type (input vs output)
Time-based trends
This allows teams to move beyond aggregated totals and focus on what is actually driving spend. Pump reduces the need for:
Manual data extraction
Spreadsheet-based analysis
Complex internal dashboards
By presenting AI costs in a structured format, it enables both finance and engineering teams to:
Investigate cost changes more efficiently
Understand usage patterns more clearly
Align on a shared view of AI spend
The goal is not to replace AWS billing data but to make it easier to interpret and act on.
What Finance Leaders Are Saying
AI can radically change gross margins. Finance leaders, therefore, no longer regard invoice reconciliation on a 30-day basis as appropriate. Given their focus on competitive advantage, many leaders are starting to judge cost, not overall cost, but cost subcomponents.
The consistent demand from the C-suite centers on a need for:
Granular visibility into unit economics.
Faster investigation tools to audit anomalous spending.
Better cost attribution to separate R&D experimentation from the direct cost of goods sold (COGS).
Without these capabilities, finance teams are left guessing whether an increase in AWS spend is a sign of business growth or a sign of runaway infrastructure.
Conclusion
AI costs aren’t hidden. They’re just not clearly broken down by the default tools provided by cloud vendors.
As you scale your generative AI applications, your financial infrastructure must evolve alongside your engineering infrastructure. Visibility is what turns AI spend from a black box into something teams can actually understand, optimize, and forecast. By tracking your costs at the model, token, and daily level, you can finally align your AI investments with your actual business outcomes.
Similar Blog Posts
AWS Bedrock Pricing - Cost Breakdown & Savings Guide
Understanding Amazon Bedrock vs Amazon SageMaker