
View your cloud spend
Track, analyze, and report on spend across every provider and tool in your stack.
Track, analyze, and report on spend across every provider and tool in your stack.
Understand
Explain
Monitor
Plan
Share


AWS, GCP, Azure, and 20+ eng tools
Set up in under 5 minutes
Full spend visibility
Spend forecasting
Shareable reports
AWS, GCP, Azure, and 20+ eng tools
Set up in under 5 minutes
Full spend visibility
Spend forecasting
Shareable reports
AWS, GCP, Azure, and 20+ eng tools
Set up in under 5 minutes
Full spend visibility
Spend forecasting
Shareable reports
Your costs shouldn't be scattered.
View brings every cloud and tool into one dashboard, so your team makes decisions instead of chasing data.
Your costs shouldn't be scattered.
View brings every cloud and tool into one dashboard, so your team makes decisions instead of chasing data.
Your costs shouldn't be scattered.
View brings every cloud and tool into one dashboard, so your team makes decisions instead of chasing data.
Your costs shouldn't be scattered.
View brings every cloud and tool into one dashboard, so your team makes decisions instead of chasing data.
Visibility your team actually uses.
MOST TEAMS THINK CLOUD COSTS
ARE SET IN STONE.
SPOILER:
THEY'RE NOT
Spend data that's easy to find, easy to understand, and easy to share.

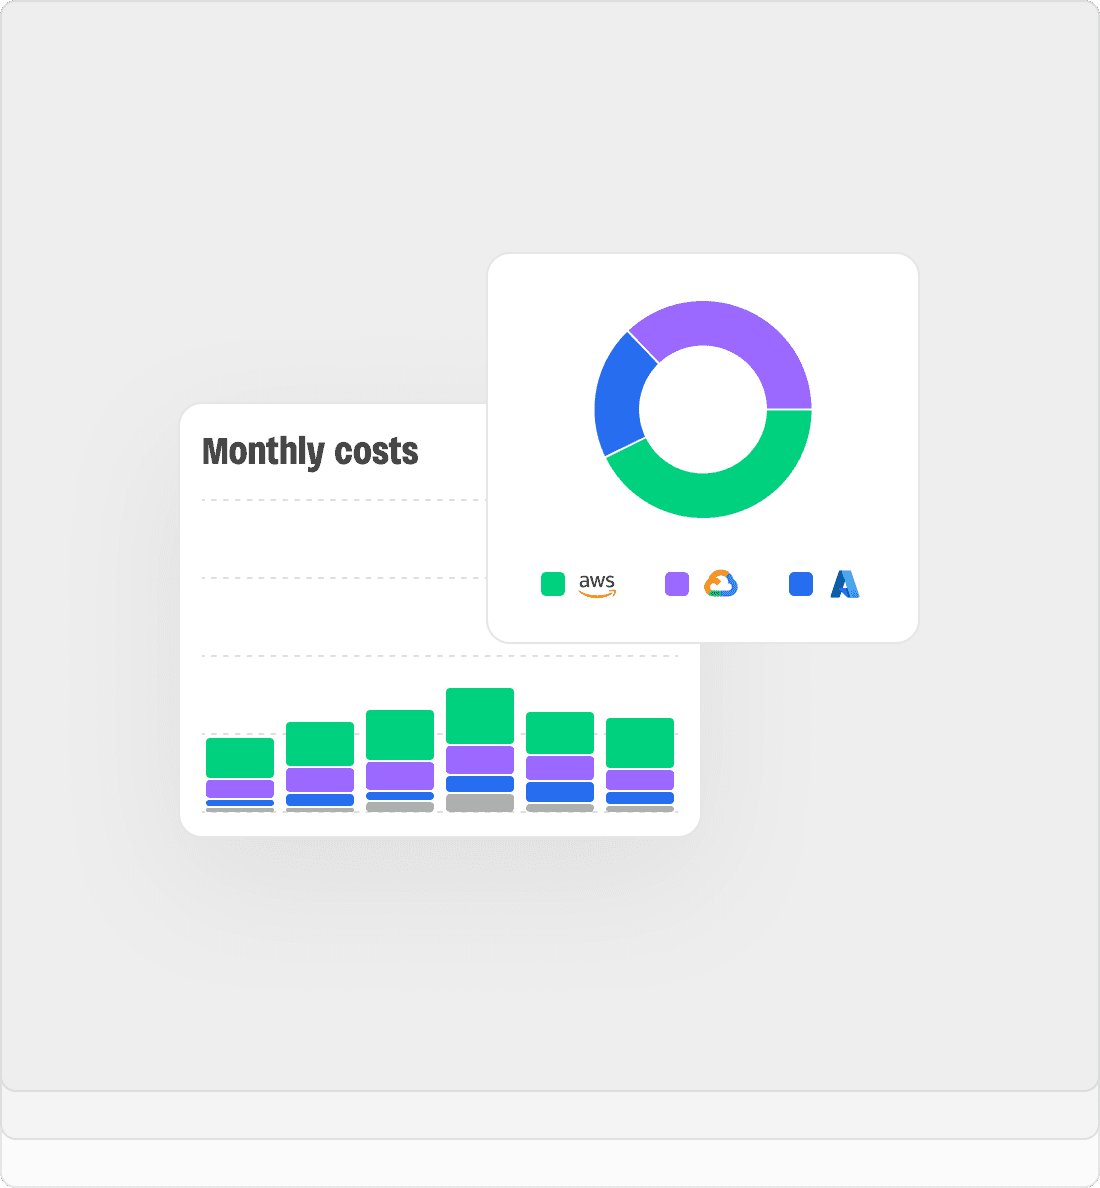
Every provider, one place
AWS, GCP, Azure, and your DevTools spend in a single dashboard. No more switching between consoles.


Context, not just numbers
View explains why your spend changed, not just that it changed.

Reports for your team
Custom reports delivered to Slack, email, or text on your schedule.

Pump View in action
See how Pump View unifies your cloud spend across AWS, GCP, and Azure, surfaces anomalies, and delivers reports where your team already works. No account needed.

Pump View in action
See how Pump View unifies your cloud spend across AWS, GCP, and Azure, surfaces anomalies, and delivers reports where your team already works. No account needed.
Pump View in action
See how Pump View unifies your cloud spend across AWS, GCP, and Azure, surfaces anomalies, and delivers reports where your team already works. No account needed.
Pump View in action
See how Pump View unifies your cloud spend across AWS, GCP, and Azure, surfaces anomalies, and delivers reports where your team already works. No account needed.
Spend visibility that keeps up with your infrastructure
Pump View connects to AWS, GCP, and Azure and continuously syncs cost and usage data. Set budgets, track trends, and get alerts before surprises hit your invoice.
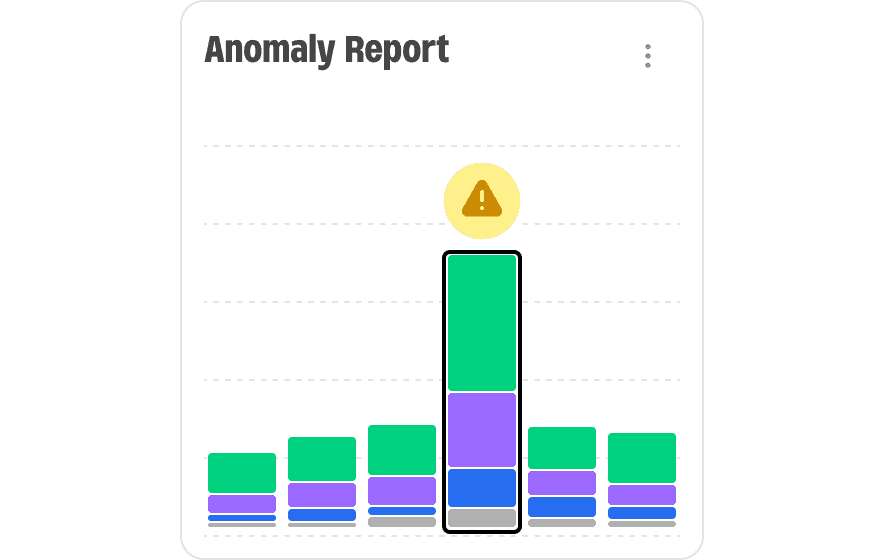
Anomaly detection
Pump View flags unexpected cost spikes and usage changes automatically. Your team gets notified through Slack, email, or text before a surprise becomes a budget problem.
Spend visibility that keeps up with your infrastructure
Pump View connects to AWS, GCP, and Azure and continuously syncs cost and usage data. Set budgets, track trends, and get alerts before surprises hit your invoice.
Anomaly detection
Pump View flags unexpected cost spikes and usage changes automatically. Your team gets notified through Slack, email, or text before a surprise becomes a budget problem.
Connect once.
Visibility from day one.
The moment you connect, View syncs cost and usage data across every account. Dashboards populate in minutes. Over time, forecasting and anomaly detection get smarter as View learns your infrastructure patterns.
Day 1
Optimization
1
Day 2-30
Refinement
2
Month 1 - Month 2
Partnership
3
Month 2+
Rewards
4
Day 1
Optimization
Day 2-30
Refinement
Month 1 - Month 2
Partnership
Month 2+
Rewards
Tap, tap $ save under 5 min
Optimizing what you use today and helping you design what you'll build tomorrow.
Lean team
10-30 engineers
Every dollar saved is another week of runway. Pump handles commitments automatically so your engineers can focus on shipping, not reading billing docs.
Mid-market teams
30-75 engineers
Cloud spend is getting serious, and so is the cost of getting it wrong. Pump layers commitments, infrastructure recommendations, and Kubernetes autoscaling to cut spend without slowing your team down.
Grant Pump a read-only permission and view your future savings.
Scaling orgs
At this size, savings compound into real budget, new headcount, new bets, room to take risks. Pump runs every savings mechanism continuously across AWS, GCP, and Azure so your finance team sees the impact quarter over quarter.

Our customers insist we charge. We disagree
Cloud providers pay Pump to manage billing complexity and reduce churn. That means your team gets savings automation, unified visibility, security posture, and operational support without adding a line item to your budget.

“Pump View has been able to save our team lots of time and money.”

Roland Fiala
SVP Engineering

"Pump cuts cloud savings to minutes while keeping performance high."

Himanshu Gupta
Co-Founder

"We didn't realize how much we were leaving on the table until Pump showed us."

Kyriakos Eleftheriou
CEO

"We use Pump View to track our EC2 spend. It's the cost visibility we were always missing."

Seth McCombs
Founding Engineer

"Pump has been able to save our team lots of time and money by surfacing and executing different savings recommendations."

Caroline Shepherd
Technical Lead

"We knew we were overpaying but didn't have time to figure out where. Pump made it obvious."

Patrick Murphy
DevOps Tech Lead

“Onboarded in under a week. Savings before the week was out.”

Daniel Sanchez
CTO
Our customers insist we charge. We disagree
Cloud providers pay Pump to manage billing complexity and reduce churn. That means your team gets savings automation, unified visibility, security posture, and operational support without adding a line item to your budget.
“Pump View has been able to save our team lots of time and money.”
Roland Fiala
SVP Engineering
"Pump cuts cloud savings to minutes while keeping performance high."
Himanshu Gupta
Co-Founder
"We didn't realize how much we were leaving on the table until Pump showed us."
Kyriakos Eleftheriou
CEO
"We use Pump View to track our EC2 spend. It's the cost visibility we were always missing."
Seth McCombs
Founding Engineer
"Pump has been able to save our team lots of time and money by surfacing and executing different savings recommendations."
Caroline Shepherd
Technical Lead
"We knew we were overpaying but didn't have time to figure out where. Pump made it obvious."
Patrick Murphy
DevOps Tech Lead
“Onboarded in under a week. Savings before the week was out.”
Daniel Sanchez
CTO
Ready to see where your cloud budget actually goes?
Join 3,000+ engineering teams using Pump to track, forecast, and manage cloud spend across AWS, GCP, and Azure.
Ready to see where your cloud budget actually goes?
Join 3,000+ engineering teams using Pump to track, forecast, and manage cloud spend across AWS, GCP, and Azure.
Ready to see where your cloud budget actually goes?
Join 3,000+ engineering teams using Pump to track, forecast, and manage cloud spend across AWS, GCP, and Azure.

Cloud costs, security, and operations.
One platform.
Cloud costs, security, and operations.
One platform.
Cloud costs, security, and operations.
One platform.
Cloud costs, security, and operations.
One platform.