

Imagine you are trying to create engaging dashboards with advanced business analytics, and you are still entangled in server upkeep and infrastructure issues. The easiest solution for you is to use AWS QuickSight.
When companies are overloaded with data, the ability to process information in a fast and efficient manner is invaluable. I have witnessed the transformative ability that Amazon QuickSight, a serverless BI and cloud-native solution, provides in helping companies visualize data, share insights, and improve decision-making.
For analysts, business users, and professionals in both startups and enterprises who are focused on cloud-based analytics, this will be helpful. In this article, I will tell you the entire AWS QuickSight system and process, its important functionalities, and relevance to its industry pricing.
What Is AWS QuickSight?
AWS QuickSight service is one of the cloud-based business intelligence services provided by Amazon that enables you to connect to the data, design interactive charts, and share the dashboards with the users within the organization safely. QuickSight is a fully managed service, hence there is no requirement to set up or maintain any sort of infrastructure - all the focus can be directed towards extracting value from the data.
Within the AWS ecosystem, QuickSight is able to connect with data sources such as Amazon S3, Amazon Redshift, and Amazon RDS, as well as third-party data sources, spreadsheets, and various SaaS applications, making it a convenient data center.
QuickSight’s core and main value is providing fast, serverless, scalable business intelligence. Traditional business intelligence tools are used within a set perimeter; there are often a number of capital requirements spent on complex hardware and setup. On the other hand, cloud-based alternatives like QuickSight are easier as there are no rigid contracts to follow, you are charged based on usage, and it can scale up to whatever the business needs. This makes it an agile and cost-effective solution for any business.
How AWS QuickSight Works
With QuickSight, the process of going from raw data to actionable insights is greatly simplified with the help of a streamlined workflow design. It connects to your data, analyzes it, and enables you to create and distribute your analysis and visualizations.
At the Core of this process is SPICE (Super-fast, Parallel, In-memory Calculation Engine). SPICE serves as QuickSight’s in-memory data store and is designed to provide fast performance on a large number of queries. When data is imported into SPICE, it’s automatically replicated to enhance availability and retain the ability to perform quick calculations.
This typical workflow consists of the following steps:
Connect to Data: QuickSight can be linked to AWS cloud, on-premises, or to third-party applications.
Prepare and Ingest into SPICE: Analyze your data and store it in SPICE for high-speed access, or use a direct query for real-time access.
Visualize and Analyze: Build interactive visualizations of your data analysis. QuickSight performs predefined analytics on the data to recommend the optimal visualization.
Gain Insights: Make use of available Machine Learning capabilities to analyze and visualize complex datasets for possible hidden patterns, leveraging forecasting analysis to determine the most useful insights you need, as well as querying information in natural language form via Amazon Q.
Publish and Share: Using QuickSight, create a dynamic analytical dashboard complete with your observations, and then disseminate it to other users for access on any device.
Key Features of AWS QuickSight
With QuickSight’s features, data analytics can now be used by almost anyone within an organization.
Scalability and Performance with SPICE
With QuickSight, there is no need to worry about configuring the system to meet the demands of thousands of users on the system. The serverless design of QuickSight takes care of that automatically. SPICE also makes sure that the dashboards are fast and responsive, even during peak hours at the office.
Machine Learning Insights
There’s no need to settle for the standard data visualizations. QuickSight users can benefit from.
Auto Narratives: Produces a narrative summary for the data highlights, making it easier for the data to be understood.
Forecasting: Uses ML algorithms to predict future trends based on historical data.
Amazon Q: A generative BI assistant that lets you ask questions about your data in natural language, build dashboards automatically, and create data stories.
Dynamic Dashboards and Visualizations
Give users the ability to create sophisticated, dynamic dashboards with many visual formats. Users can use the tools themselves to filter, examine, and analyze the data to encourage a self-analytic culture within the company. You can also use it to meet the paginated report requirements for operational reporting.
Embedded Analytics and Multi-tenancy
You can incorporate dashboards and data visualizations into applications, sites, and portals via embedded QuickSight APIs. This is ideal for SaaS products that wish to provide clients with analytics directly in the application. The system also supports multi-tenancy, enabling secure data segregation between different end users.
Deep Integration with the AWS Ecosystem
Within QuickSight, you can obtain native integration with the following AWS services and many others:
Amazon Redshift
Amazon S3
Amazon Athena
Amazon RDS
Amazon Aurora
This close integration greatly reduces the complexity of accessing analytics data, ensuring that the analytics environment is fully integrated with the data infrastructure.
Security and Governance
QuickSight is equipped with comprehensive security suited for advanced users. Managed user access using AWS IAM, enforcing data visibility through column and row-level access, and standard compliance such as HIPAA and PCI DSS. Any data kept indecipherable on SPICE is always encrypted.
AWS QuickSight Pricing Explained
Particularly for large deployments, QuickSight prices set a flexible, cost-effective approach, avoiding high-value, traditional Business Intelligence tools. Each user is charged according to their role and how much they use the tool.
User Roles and Pricing Models
There are two principal user roles, with varying abilities, and distinct price points for each:
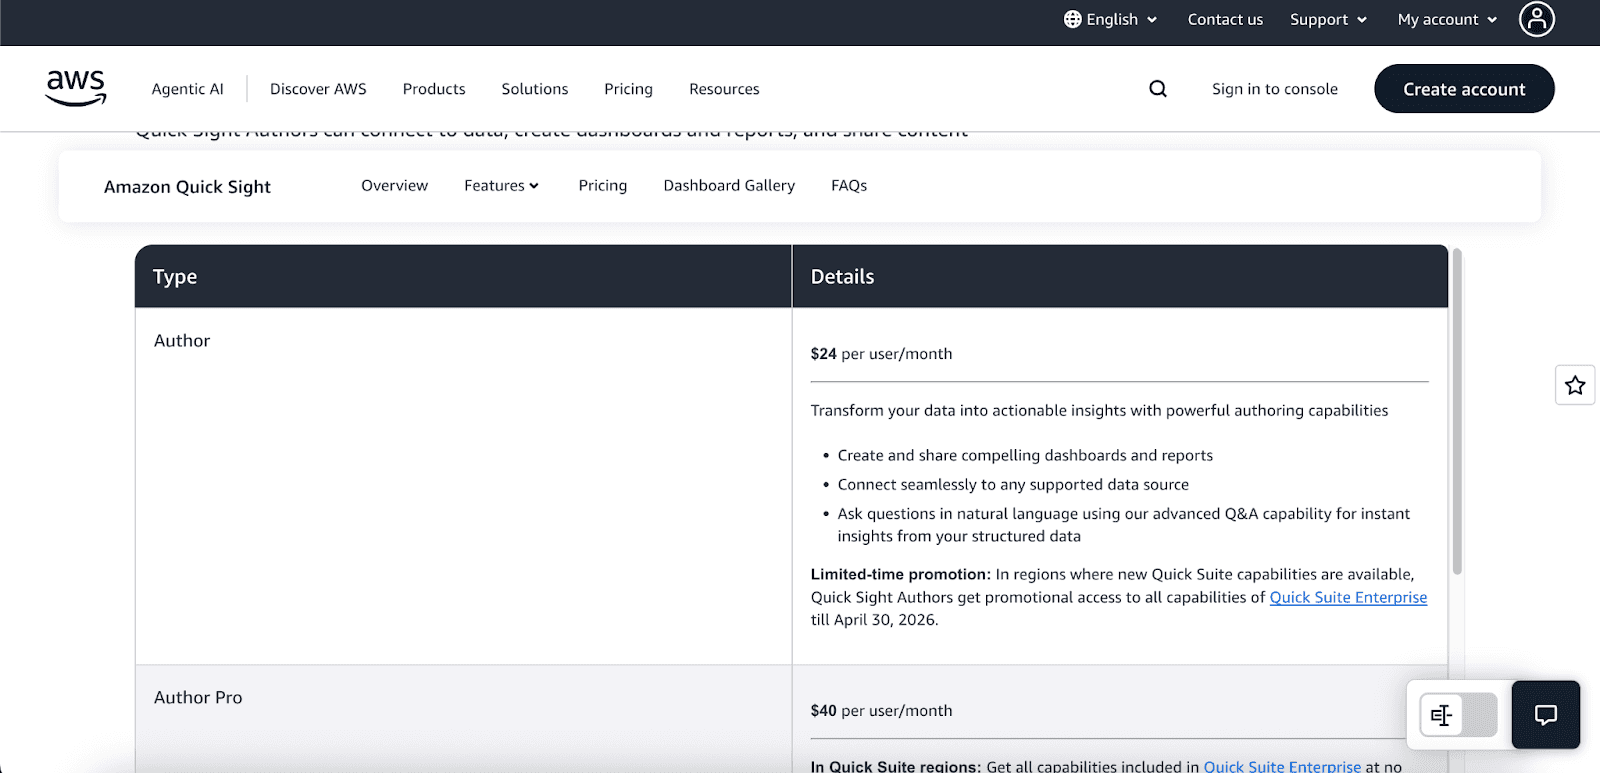
Author ($24/month): Connect to data, create dashboards, and perform detailed analyses.
Author Pro ($40/month): Has advanced insight generation and collaboration tools in addition to all Author functionalities.
Reader ($3/month): Able to view and interact with shared dashboards.
Reader Pro ($20/month): Has all Reader functionalities, in addition to advanced analysis and data exploration.
For users who require infrequent access, QuickSight offers a pay-per-session model for Reader, which is a more cost-effective option.
Standard vs Pro Edition
Standard Edition: Provides personal data analysis and visualization with basic core BI functionalities.
Pro Edition: Includes advanced attributes such as row-level security, Active Directory integration, paginated reporting, and the ability to leverage Amazon Q. Most organizations prefer the Enterprise Edition as it provides a more comprehensive full suite of capabilities.
SPICE Capacity Pricing
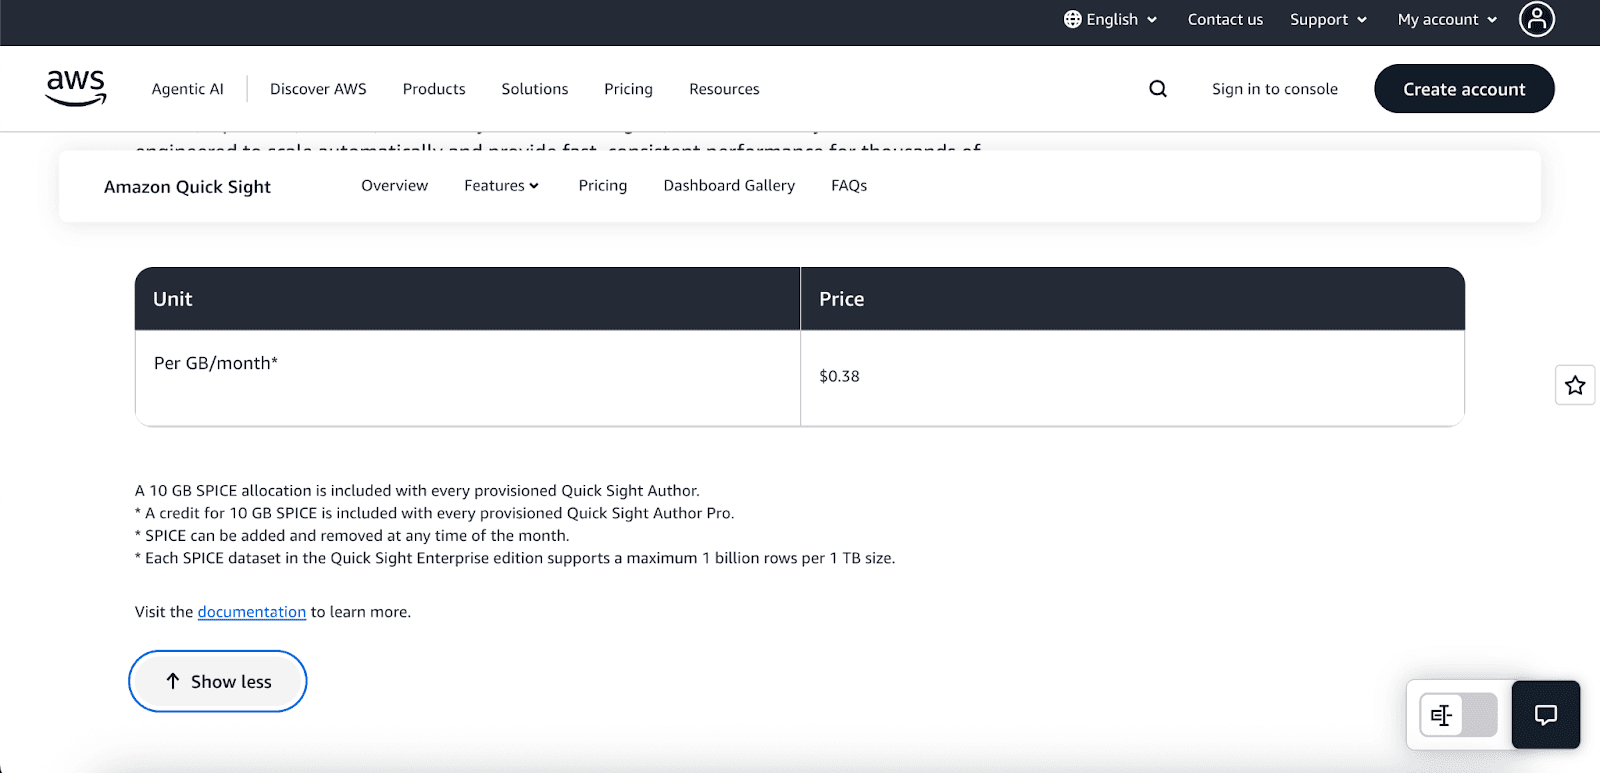
Each Author on the Pro Edition gets 10 GB of SPICE capacity, which is more than enough for a single user. But what if your data needs more? Not a problem! Additional capacity can be purchased at $0.38 per GB/month, so you will only pay for what you need, which aligns with your data requirements.
Alerts and Anomaly Detection
QuickSight provides intelligent alerts with threshold-based notifications and advanced ML-powered anomaly detection. Pricing is based on your usage, starting from $0.50 for 1,000 metrics evaluated. If you monitor a larger number of metrics, the system will reduce the cost per metric, thereby creating more value for your investments.
QuickSight Free Tier
You can start with AWS QuickSight for free. The free trial for the Enterprise Edition includes one Author user for 30 days.
AWS QuickSight Use Cases
AWS QuickSight is customizable to fulfill different business requirements in various sectors:
Startups: Analyze data in real time from Amazon Redshift to generate KPI dashboards to track business performance.
Enterprises: Simplify reporting by creating dashboards for HR, finance, and operations to monitor key metrics.
SaaS Products: Provide analytics directly in customer-facing applications for real-time data insights to users.
Data Teams: Perform predictive analytics in more sophisticated ways by merging Business Intelligence and machine learning.
AWS QuickSight vs. Other BI Tools
How does QuickSight stack up against other popular BI tools like Power BI and Tableau?
Feature | AWS QuickSight | Microsoft Power BI | Tableau |
Deployment | Cloud-native | Cloud/Desktop | Desktop/Server |
Pricing | Pay-per-session, per-user | Per-user license | Subscription |
Integration | Optimized for AWS | Optimized for Microsoft | Broad connectors |
AI Features | Built-in ML, Amazon Q | Copilot (premium) | Ask Data |
Scalability | Serverless, auto scale | Manual | Manual/Server setup |
If your data is hosted on AWS, for example, S3, QuickSight is the most cost-effective and high-performance tool to use with Redshift and Athena. In environments that are heavily Microsoft-based, Power BI is more suitable. However, in terms of flexibility and comprehensiveness for cloud analytics, QuickSight is the best choice.
Getting Started with AWS QuickSight
You will be able to create your first dashboard in a matter of minutes:
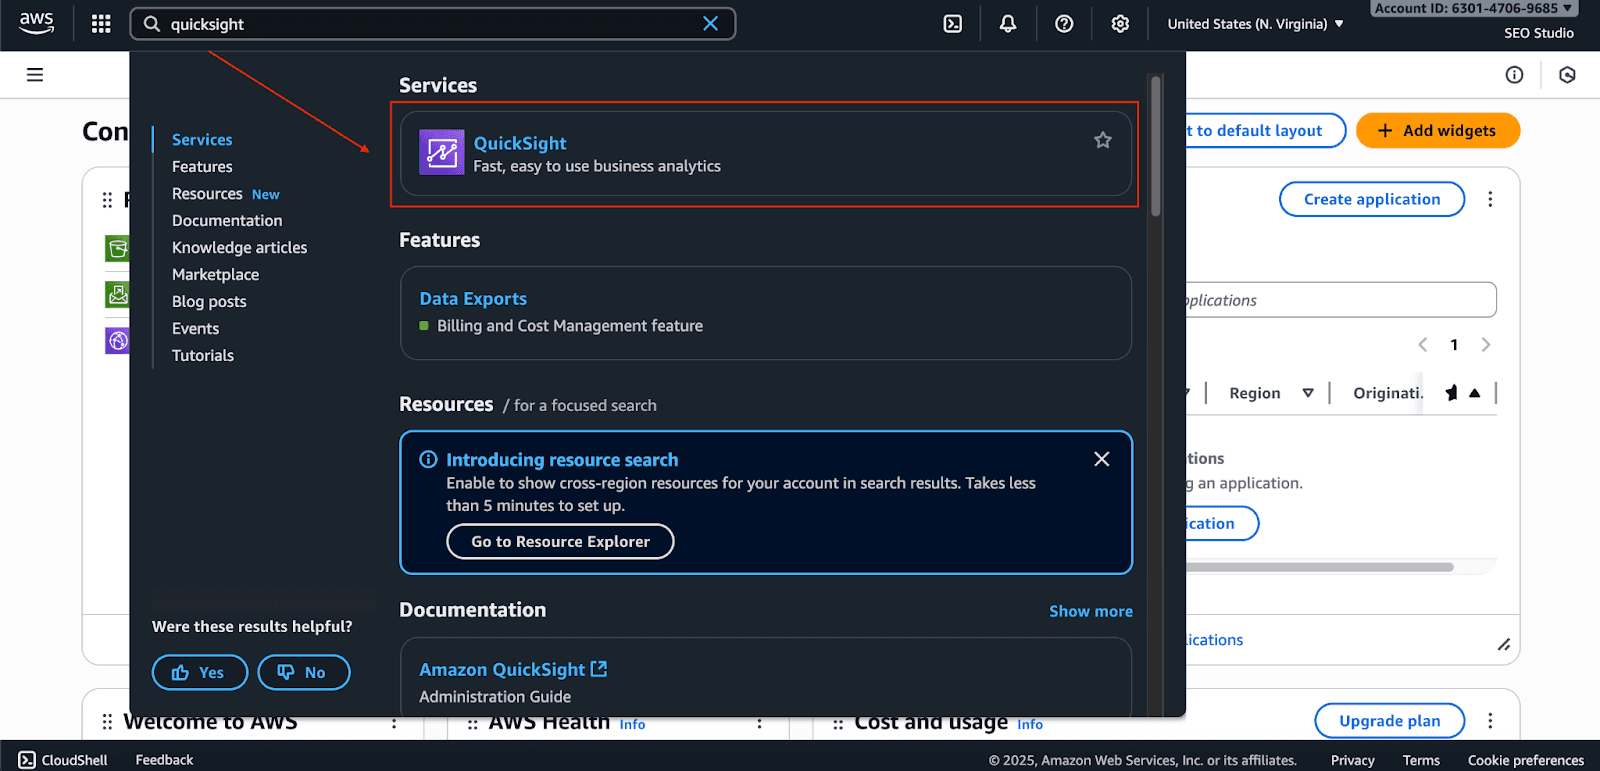
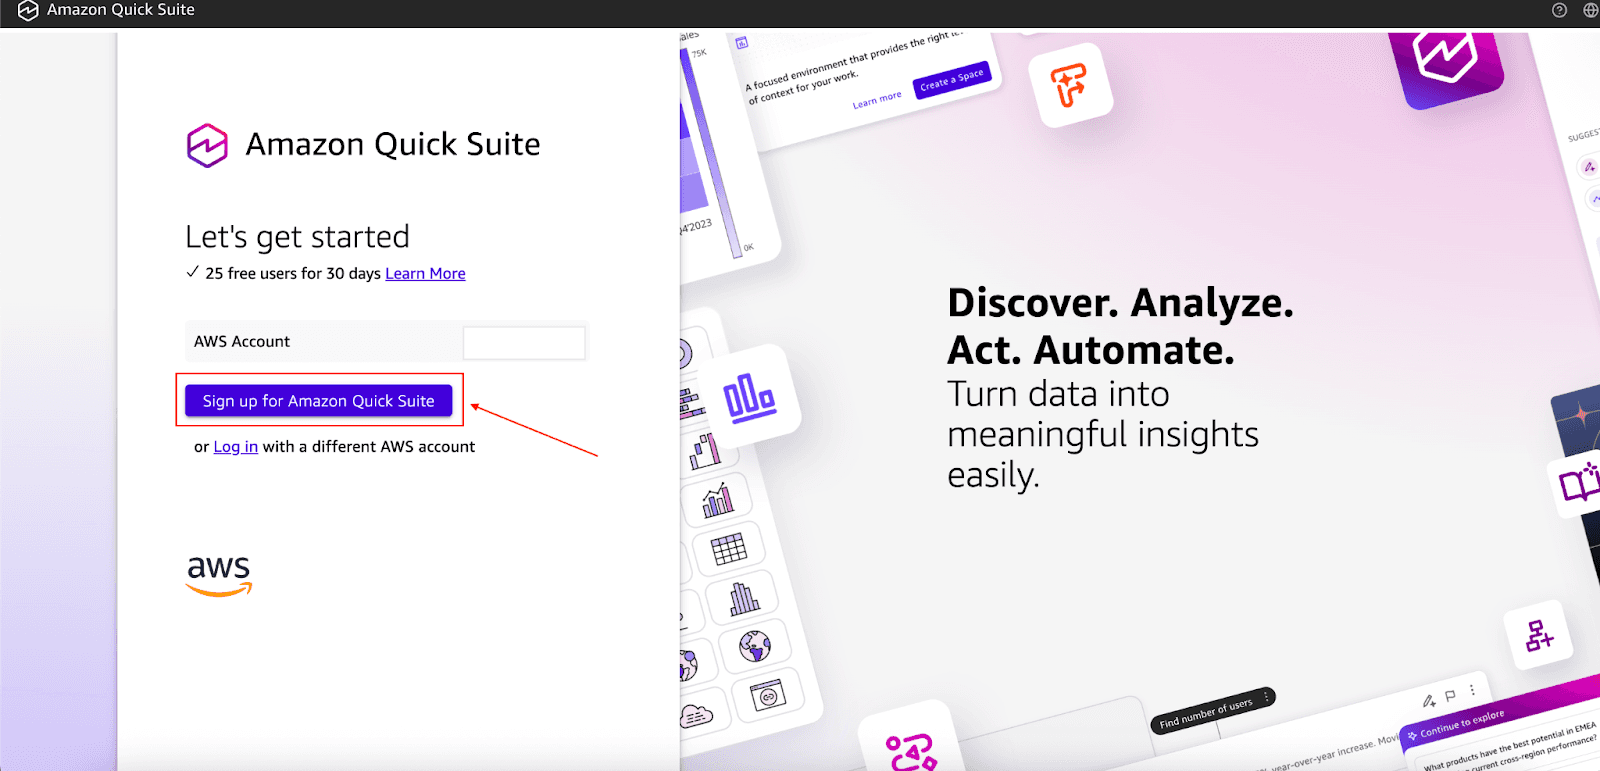
Go to QuickSight in your AWS Management Console.
Click on Sign up for Amazon Quick Suite.
Fill out all the details, like the account name, which is used for identification, and the email, which is used for notification.
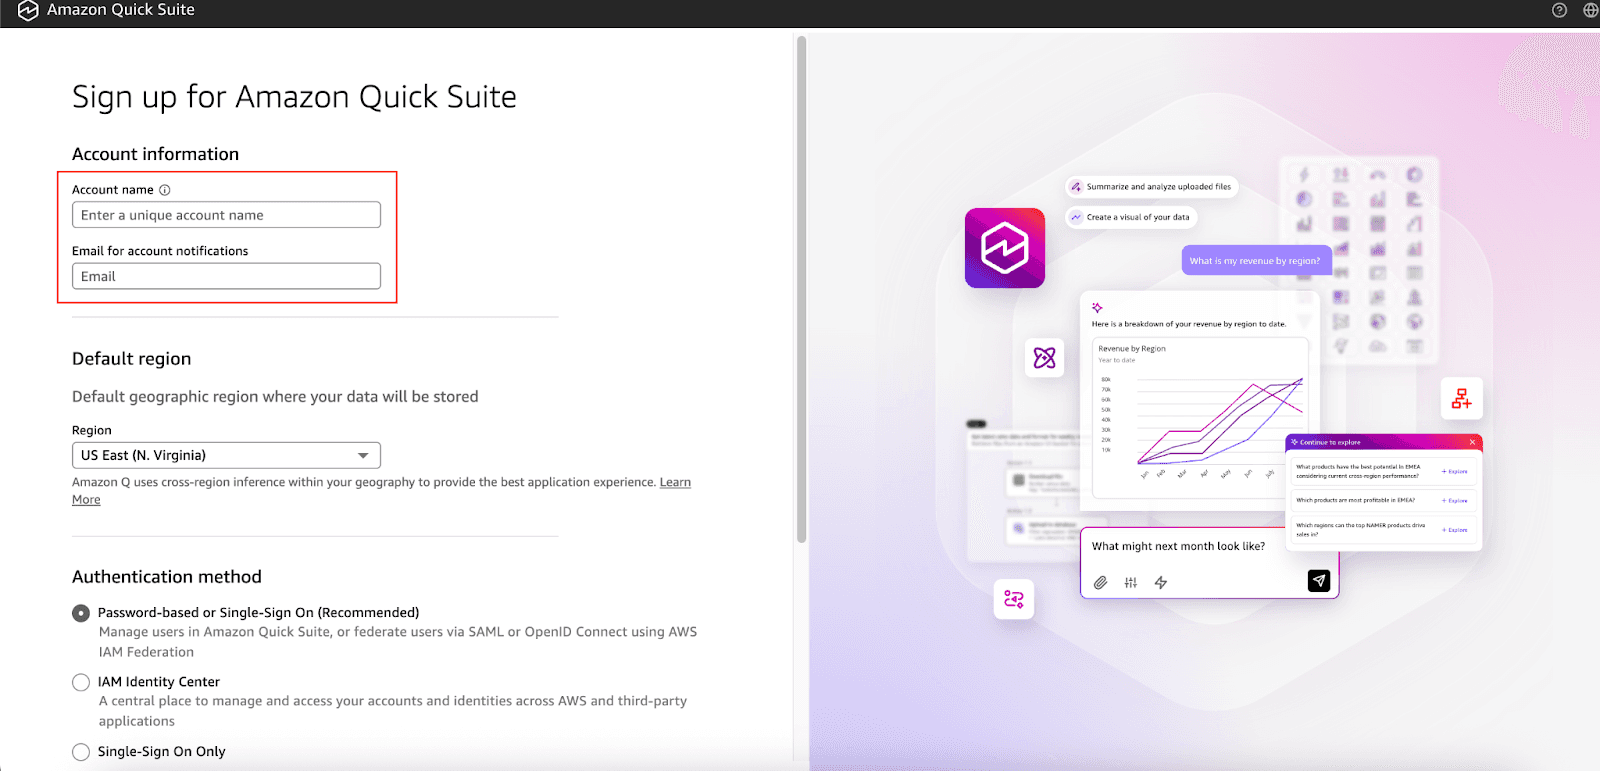
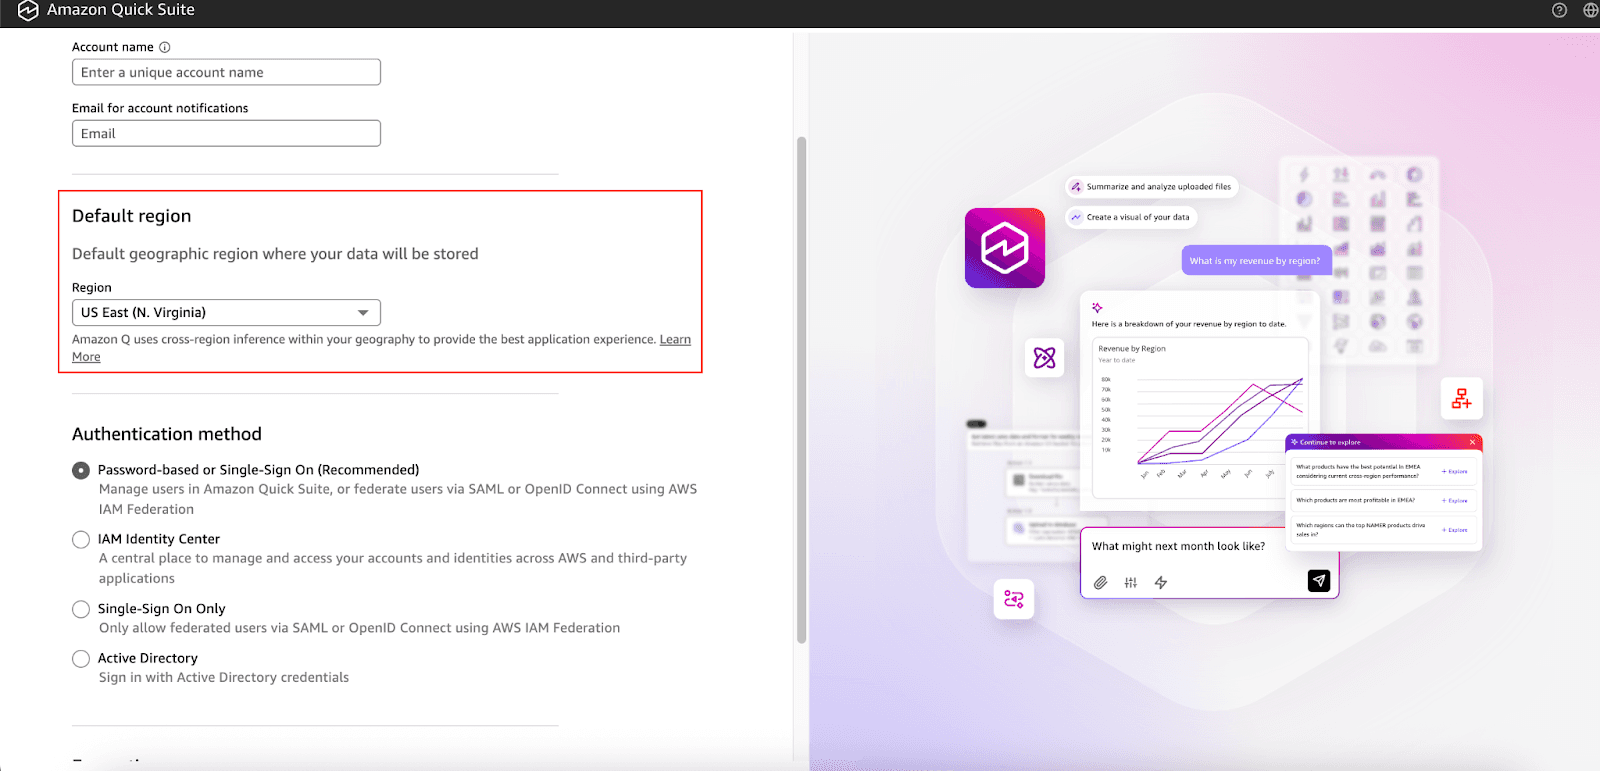
Choose the Default Region from the dropdown.
Choose the Authentication method and Encryption (For now, you can set it to Default).
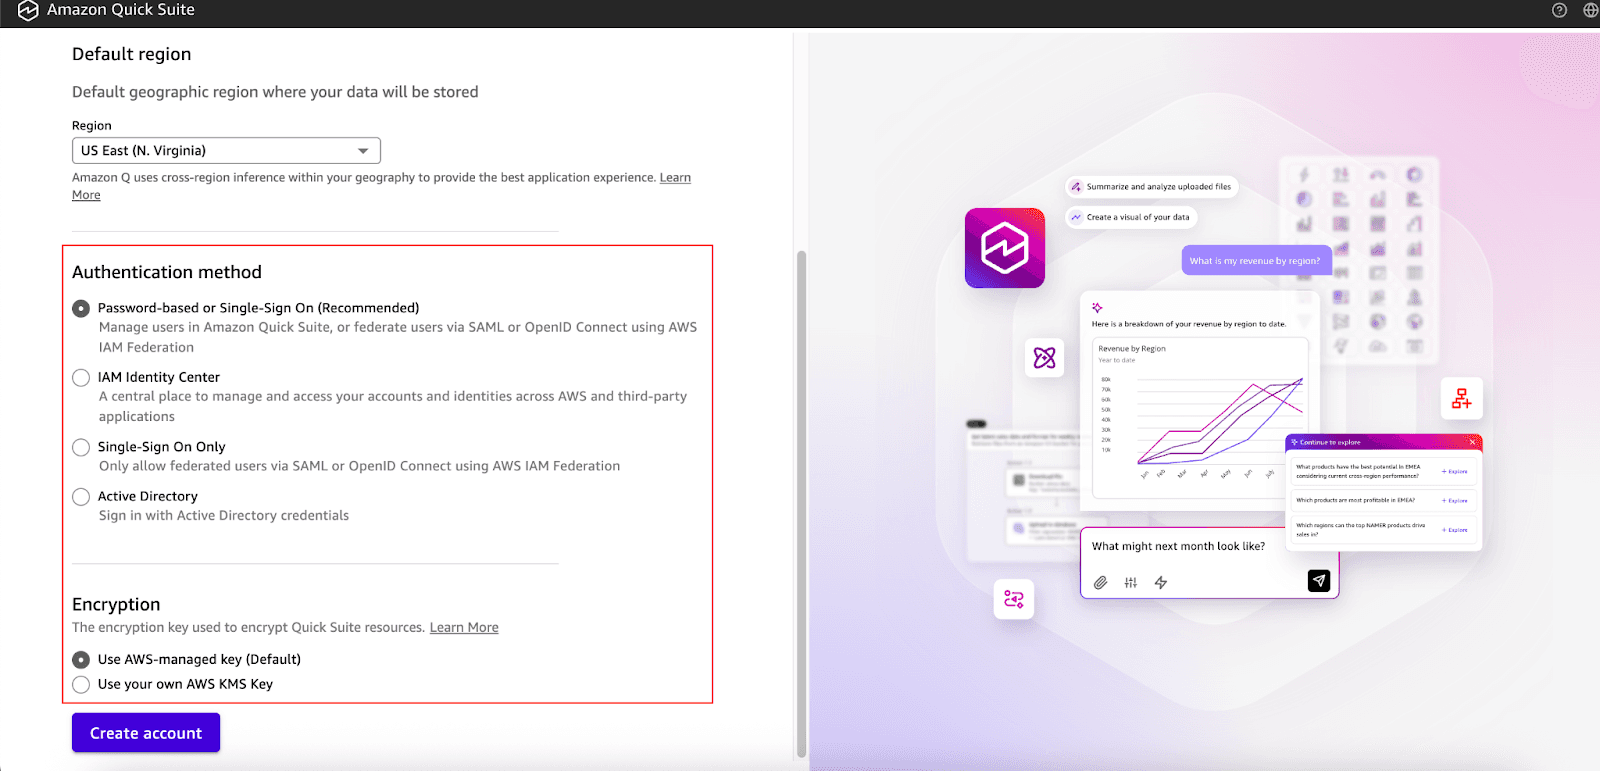
Then, click on Create account.
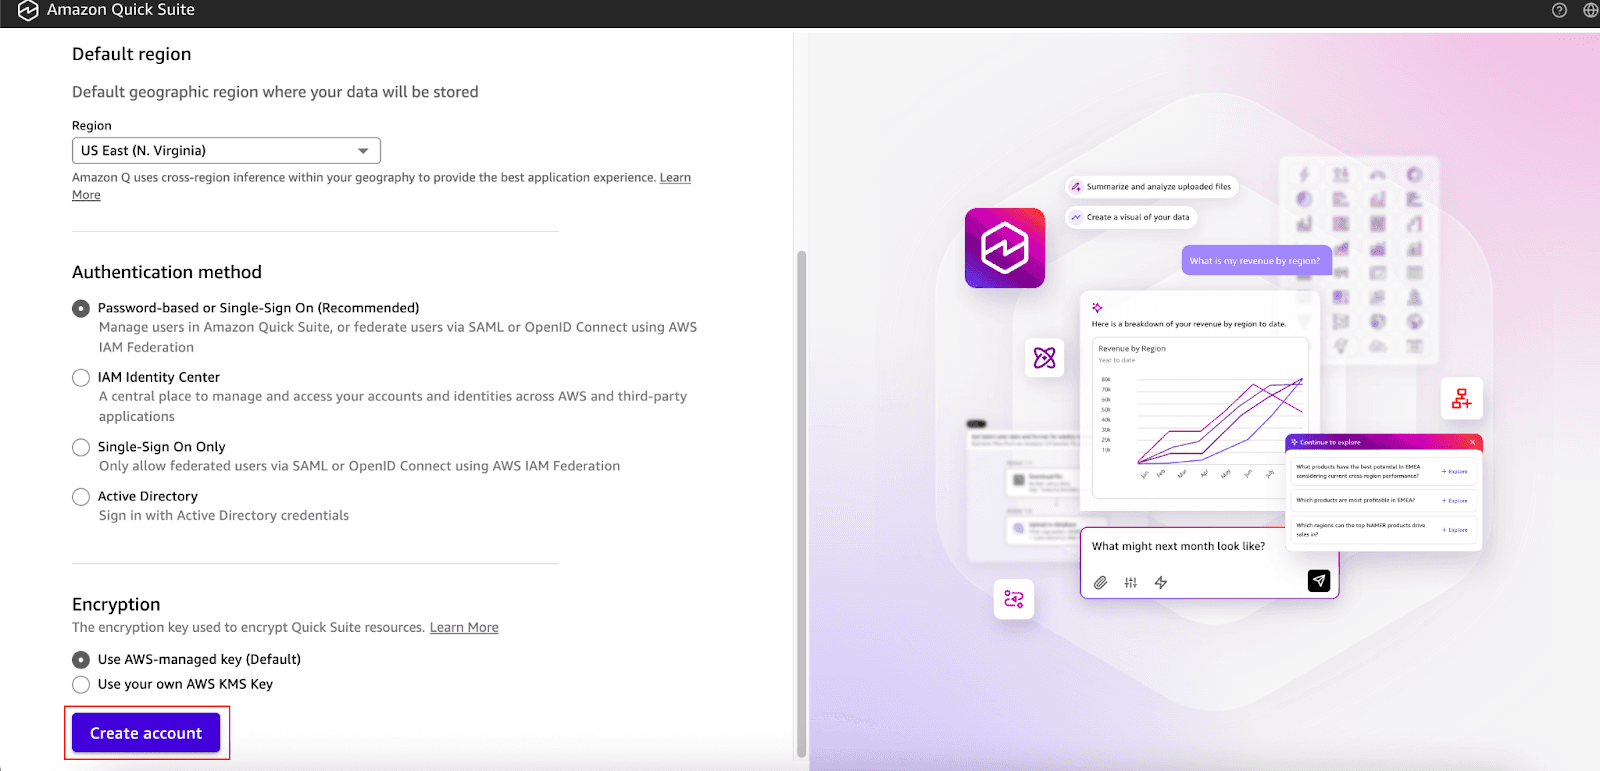
Next, connect to your data source, such as an S3 bucket or a Redshift cluster.
Challenges and Best Practices
To make the most of QuickSight, consider these best practices:
Manage SPICE Capacity: Closely monitor SPICE usage to curtail unexpected costs. Decide which datasets to import for better performance.
Optimize Dashboards: Aim to streamline your dashboards as much as possible. Visuals that are overly complex and cluttered are usually slow to load and understand.
Govern User Access: Use roles and permissions to make sure that users can only view the data that they are approved to see.
Schedule Data Refreshes: Set up SPICE datasets to automatically refresh themselves to keep your dashboards current.
Conclusion
AWS QuickSight is a cutting-edge, scalable solution to business intelligence, integrating powerful and cost-effective pay-as-you-go pricing, serverless computing, and machine learning. It is ideal for companies that want to cut down on excessive infrastructure outlays when data-driven decision-making is a must.
QuickSight is the go-to solution for startups and enterprises that want to take actionable steps towards growth and want to track vital business growth metrics.
If your company is built on the AWS platform, then QuickSight is the business intelligence which you would require. Start your QuickSight free trial today and get insights from your data faster than you ever imagined.
Join Pump for Free
If you are an early-stage startup that wants to save on cloud costs, use this opportunity. If you are a start-up business owner who wants to cut down the cost of using the cloud, then this is your chance. Pump helps you save up to 60% in cloud costs, and the best thing about it is that it is absolutely free!
Pump provides personalized solutions that allow you to effectively manage and optimize your Azure, GCP and AWS spending. Take complete control over your cloud expenses and ensure that you get the most from what you have invested. Who would pay more when we can save better?
Are you ready to take control of your cloud expenses?


